Analytics
ContainerWS surfaces two kinds of analytics in the UI:
- Dashboard host analytics — live VM/container resource metrics
- Homebrew install analytics — popularity data from formulae.brew.sh
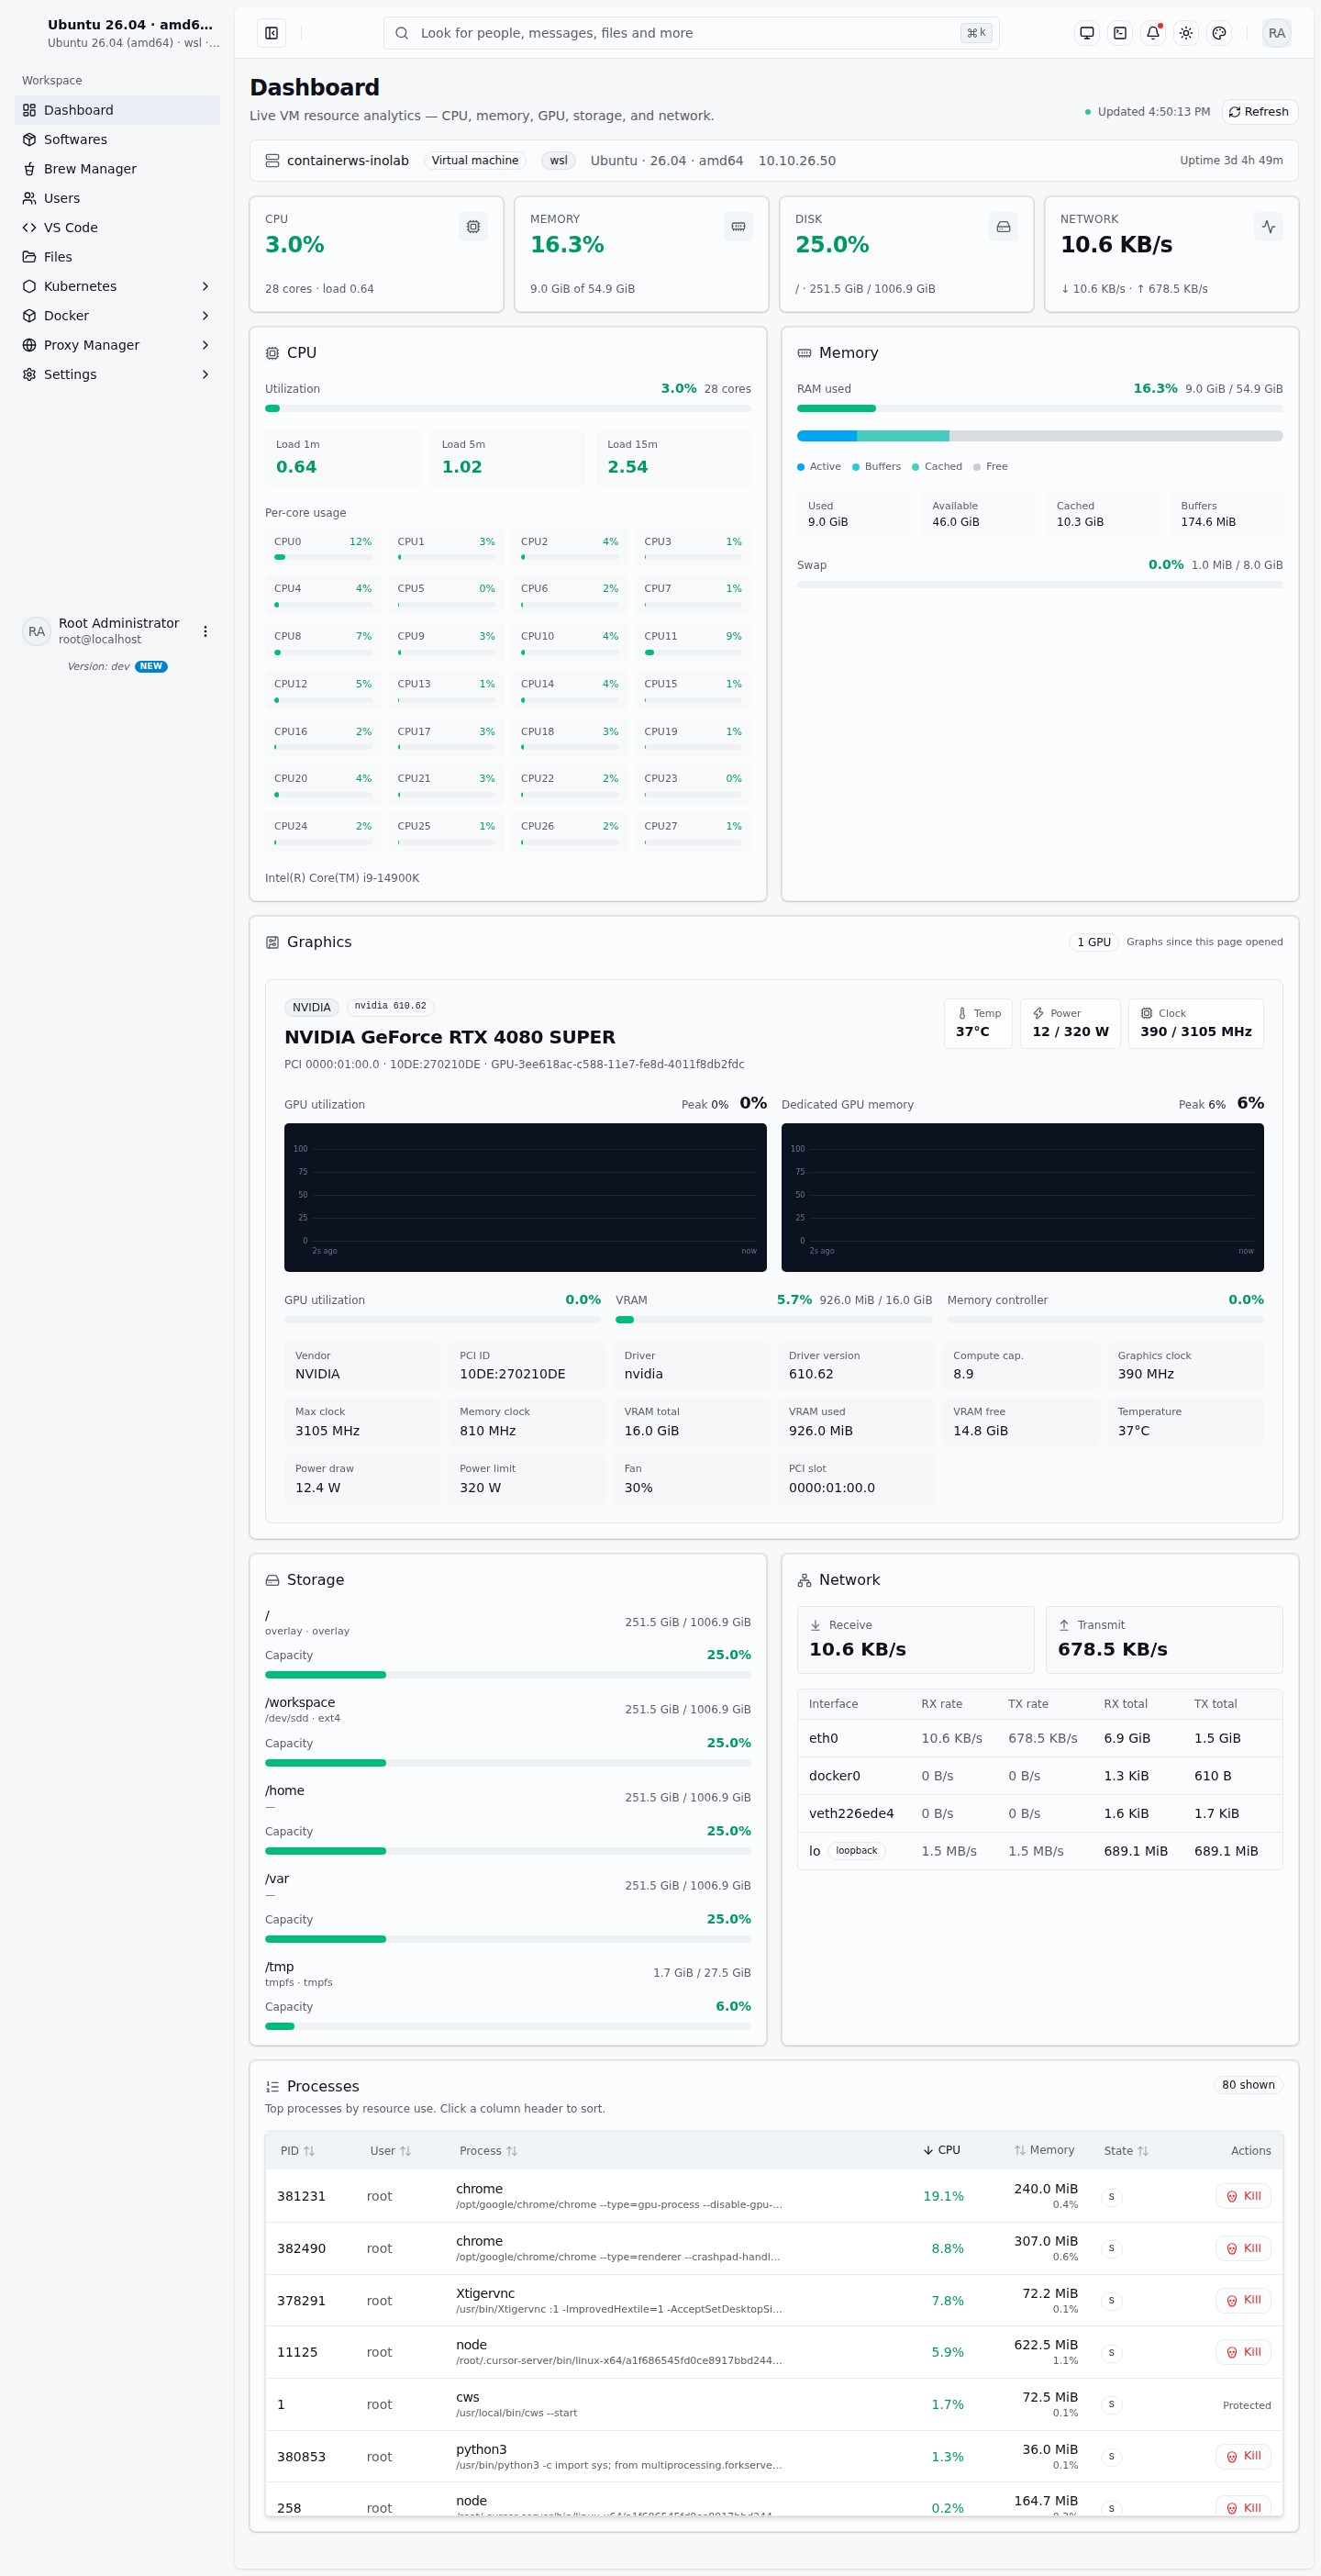
Dashboard (live host metrics)
UI: / (Dashboard)
Shows live resource analytics for the machine running cws:
| Panel | Data |
|---|---|
| CPU | Usage %, cores, load averages |
| Memory | Used % and human sizes |
| Disk | Per-mount used % |
| GPU | When drivers/tools report devices |
| Network | Interface throughput / counters |
| Tools | Softwares “tools” strip (htop, nvtop, …) |
| Processes | List / kill helpers |
Metrics refresh on an interval; use Refresh to force a poll. This is operational telemetry for the workspace host — not end-user product analytics or third-party tracking.
API surface: dashboard module (/api/dashboard metrics endpoints).
Homebrew analytics
UI: Brew → Discover / formula detail (/brew, /brew/:name)
Brew Manager pulls install counts from the public Homebrew analytics API:
GET /api/brew/analytics/install/:dayswithdays∈{30, 90, 365}- Formula and cask detail pages show 30d / 90d / 365d install counts when available
Discover highlights popular formulae (top items from the 30-day analytics feed) so you can see what is commonly installed via Homebrew.
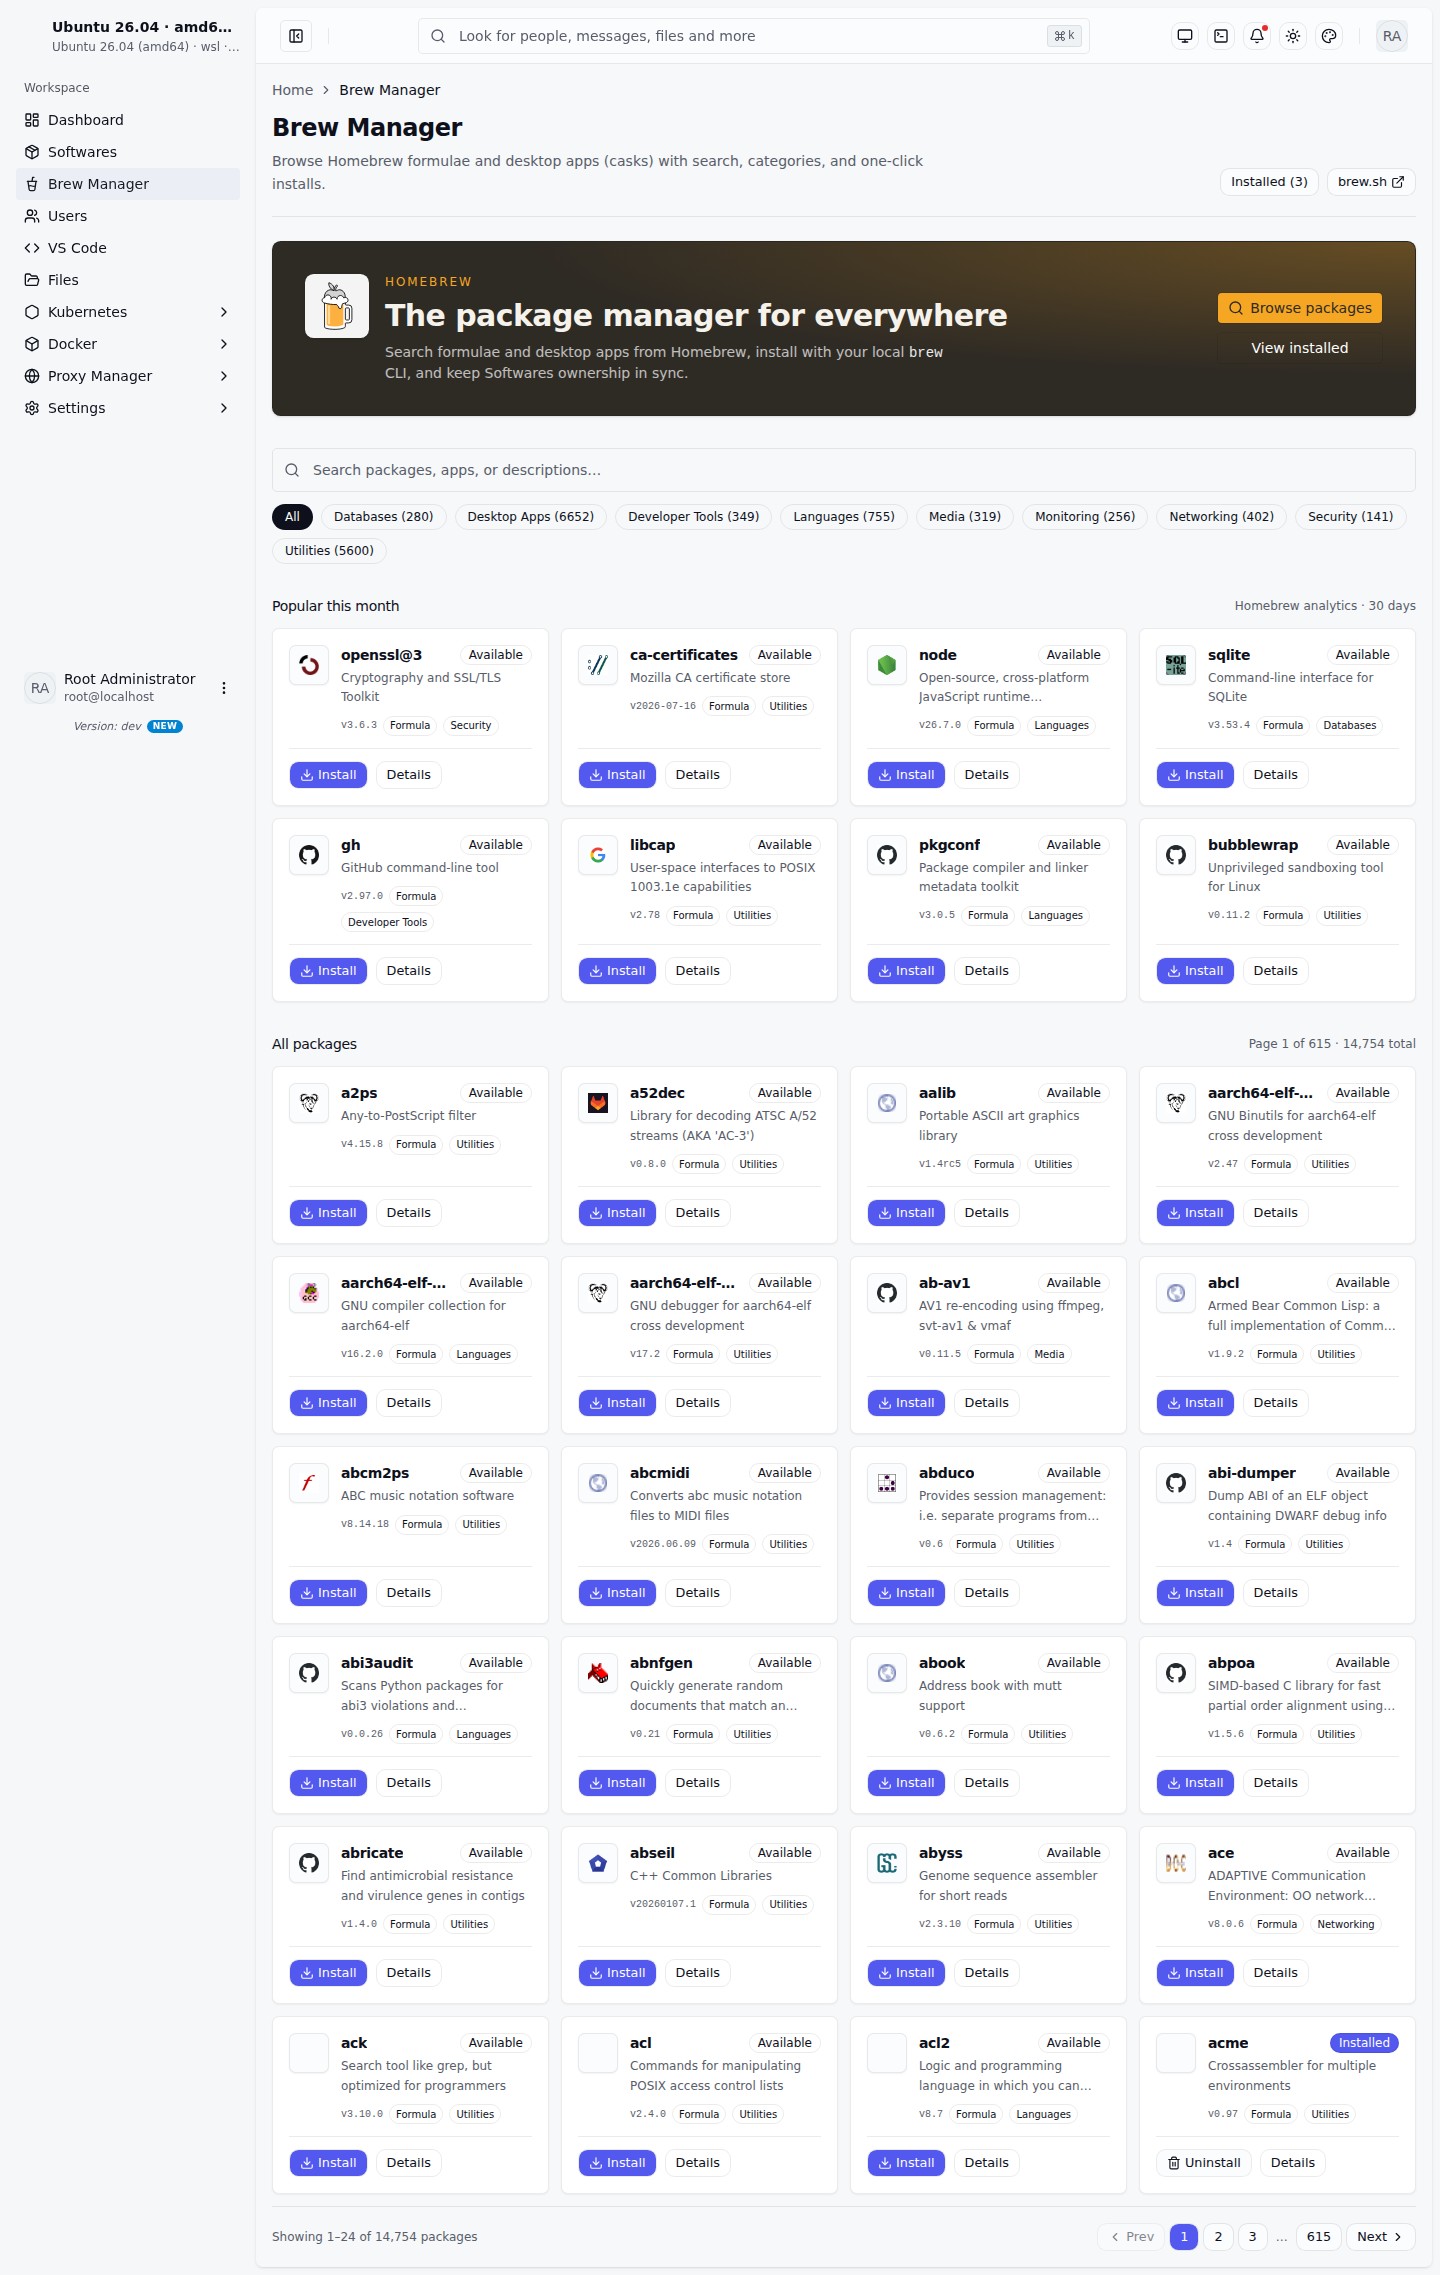
Upstream source: formulae.brew.sh analytics.
Homebrew analytics are global community stats, not counts of installs performed on your ContainerWS host. Local install history is in Softwares → Installed / Brew → Installed.